


Coffee
-
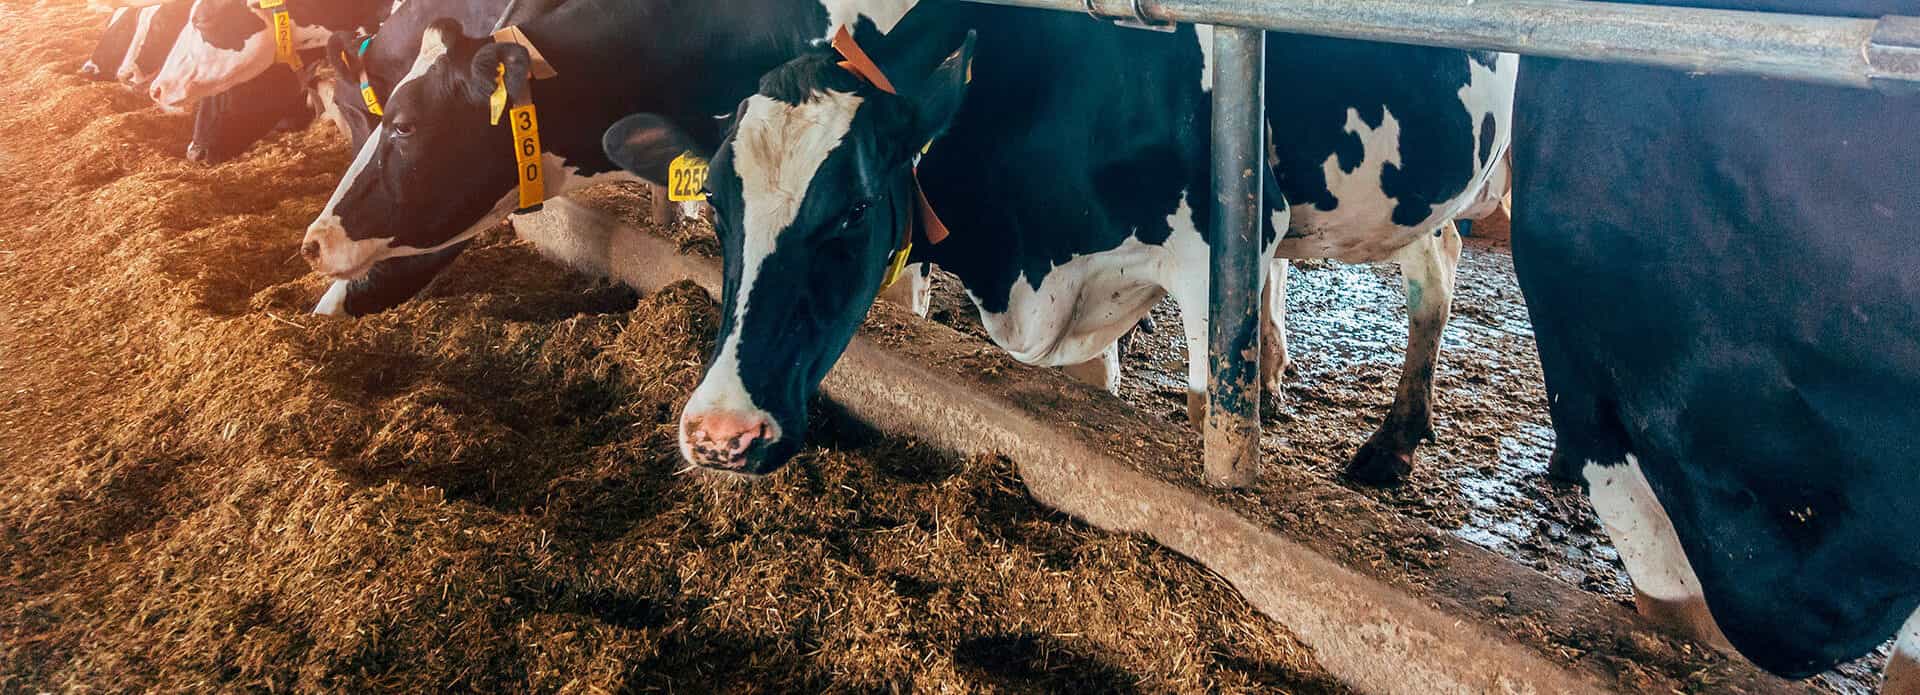
The Challenge
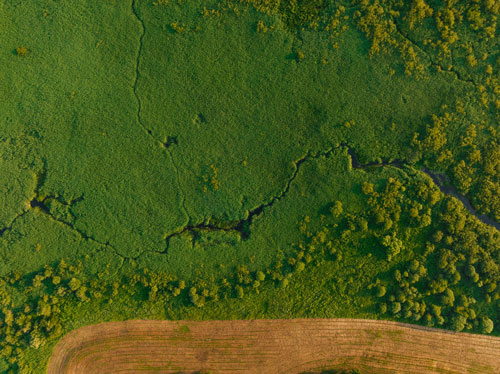
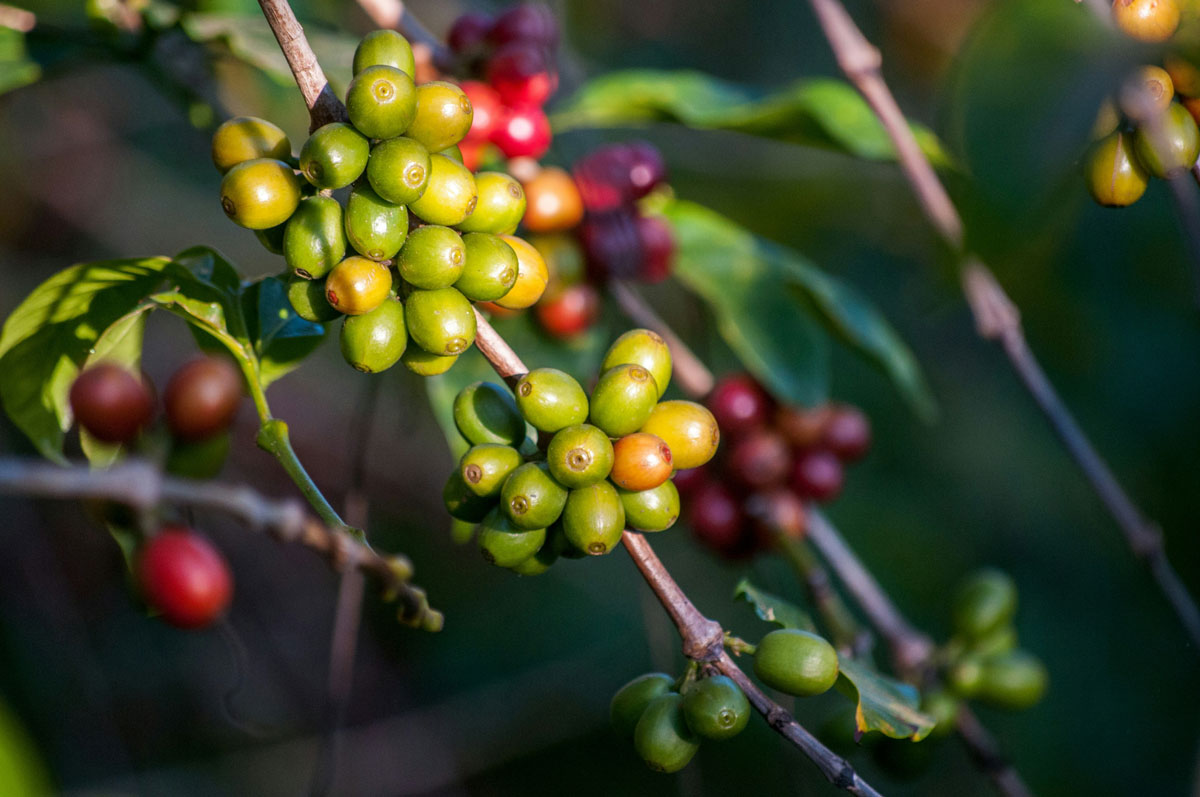
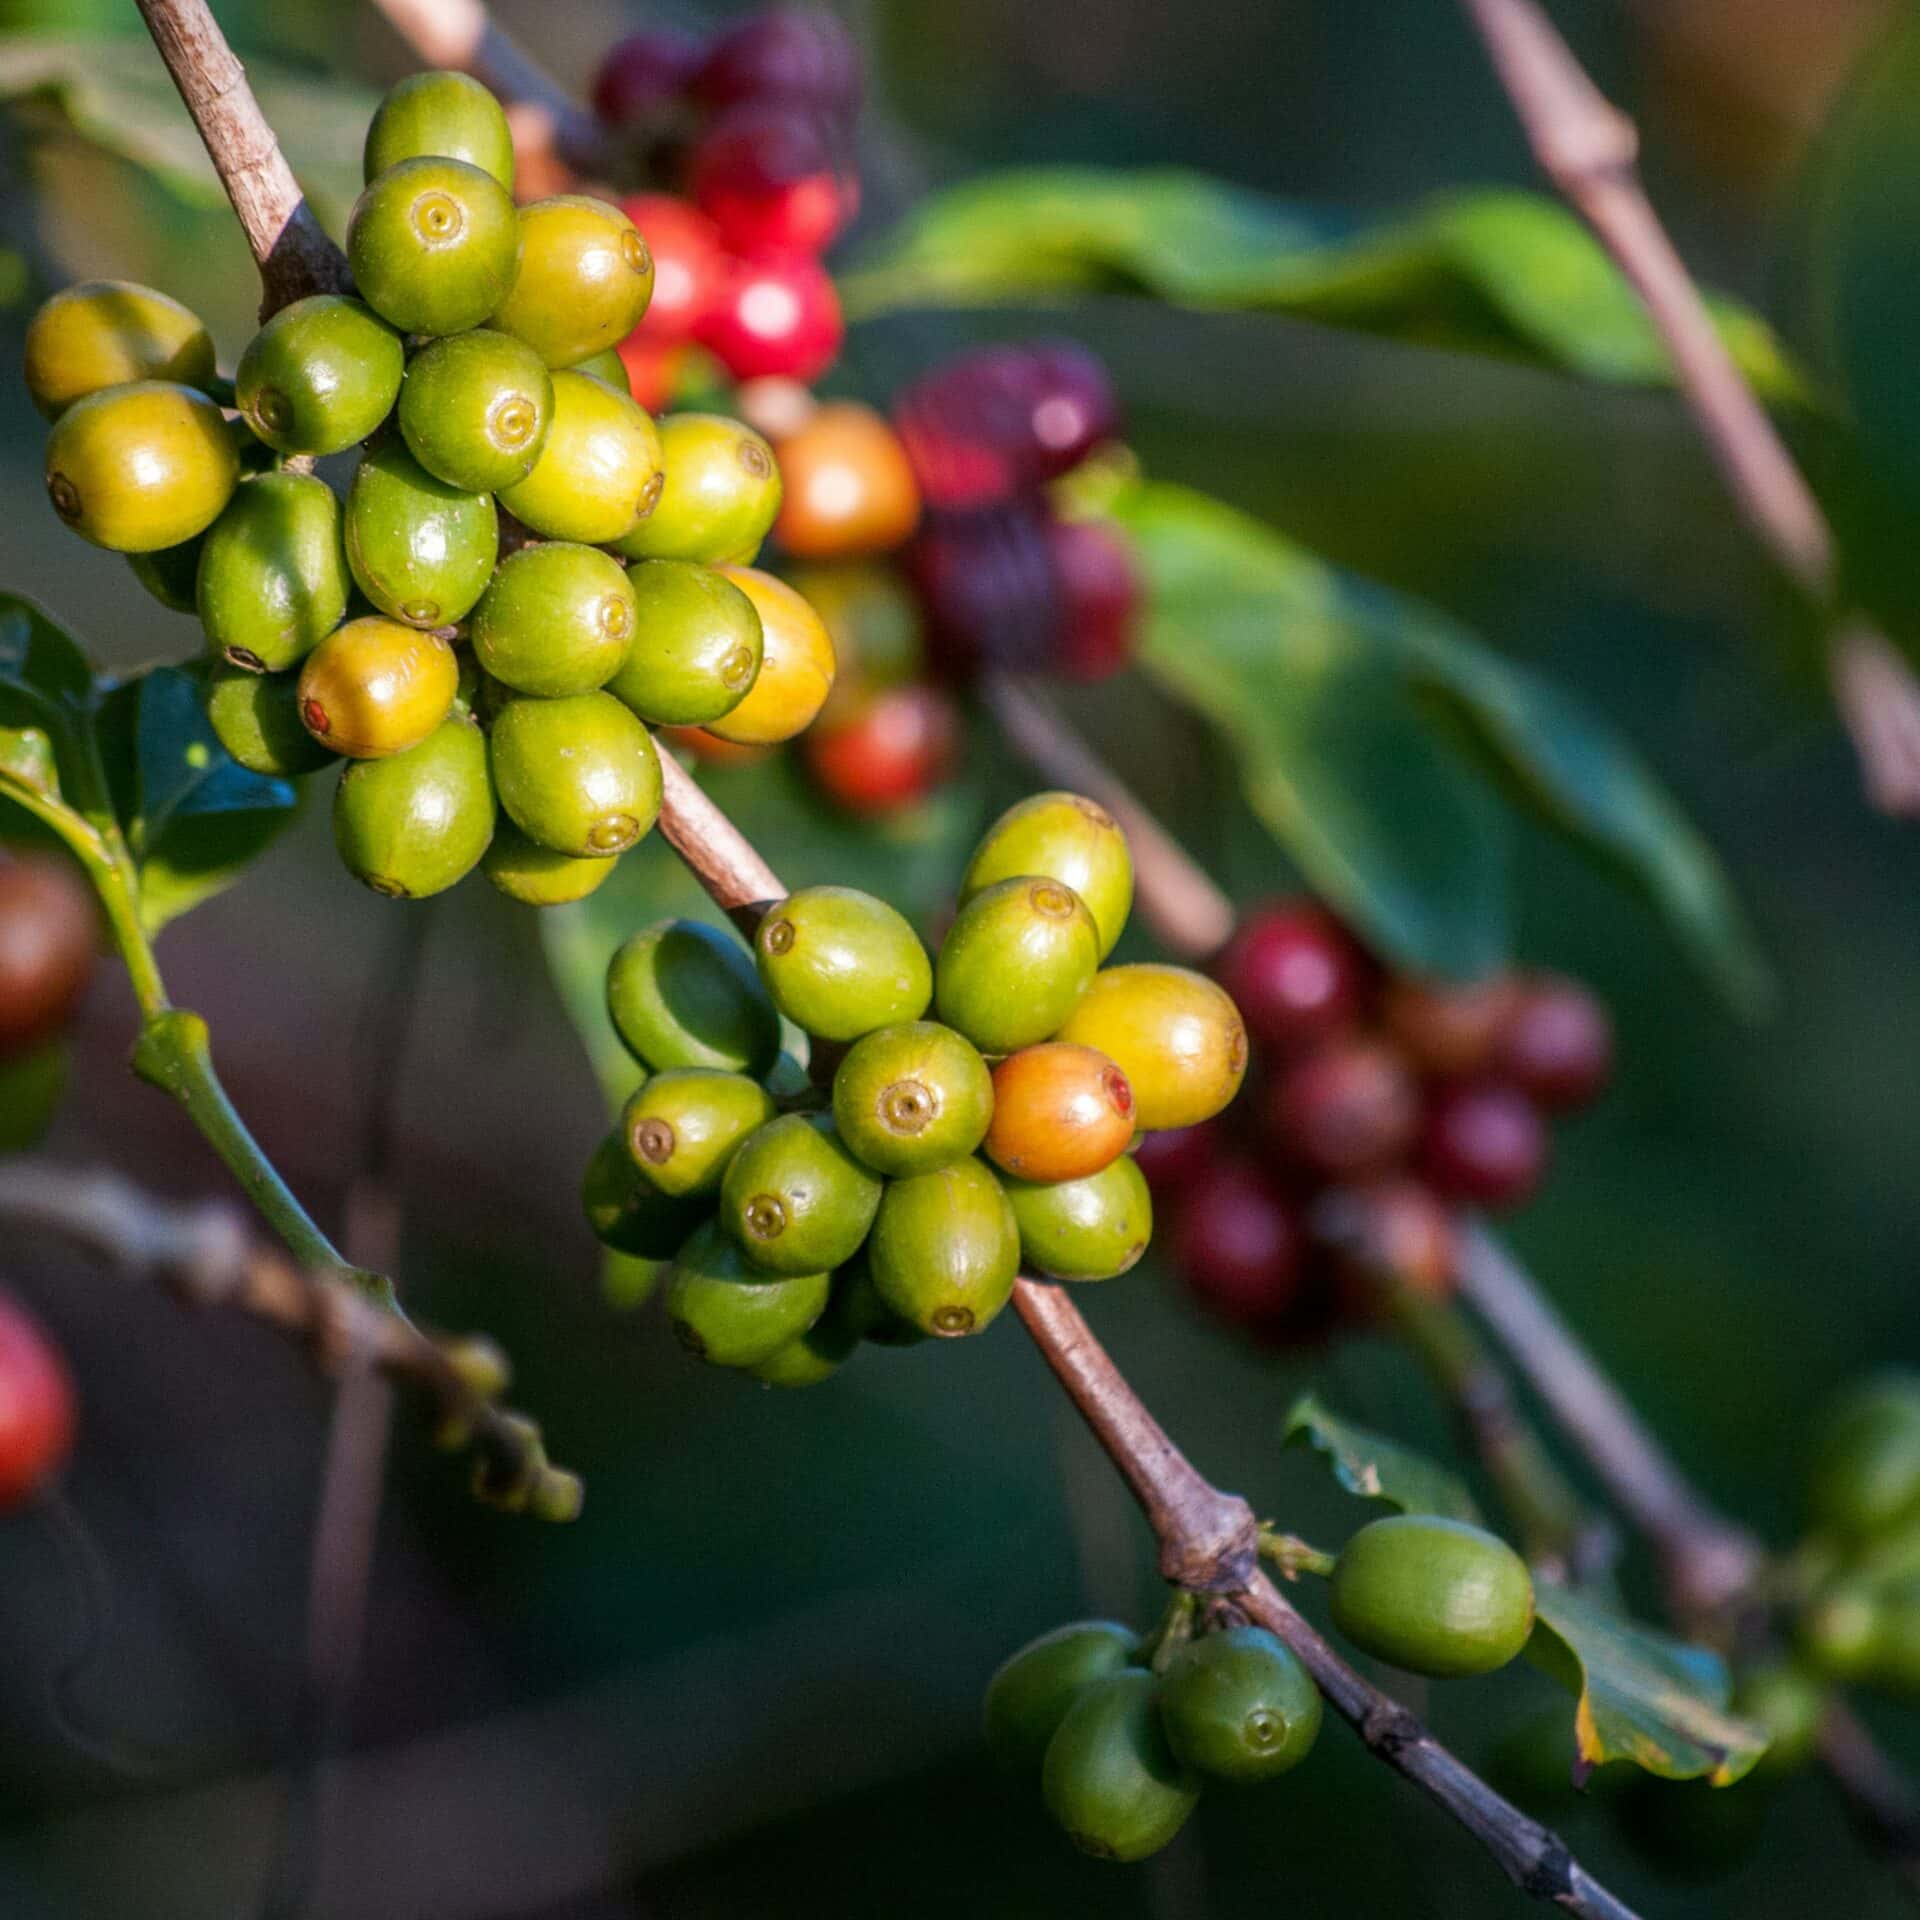
Coffee is a crucial global commodity primarily cultivated in tropical regions. Top producing countries such as Brazil, Vietnam, Colombia, Indonesia, and Ethiopia—benefit from optimal climates and fertile soils. These optimal conditions, however, are increasingly challenged by climate change, pest infestations, and diseases such as coffee rust, which adversely affect crop yields and quality.
-
The Solution
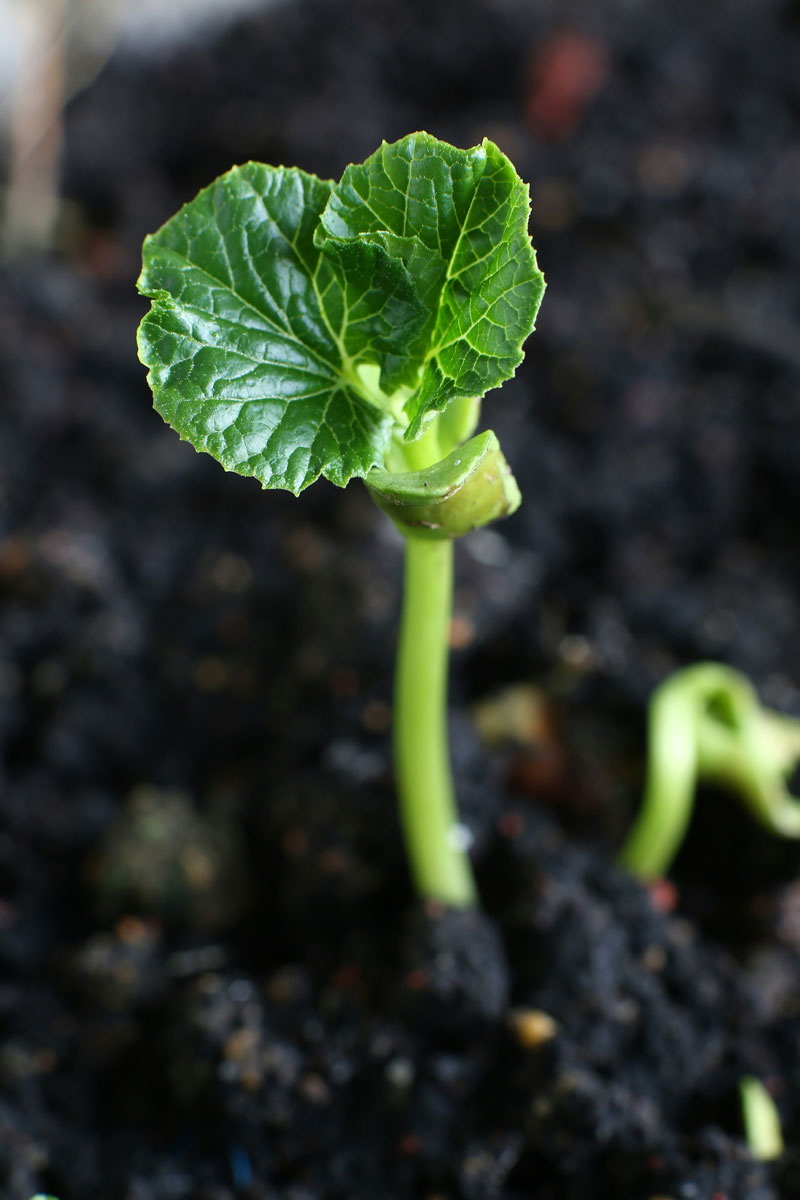
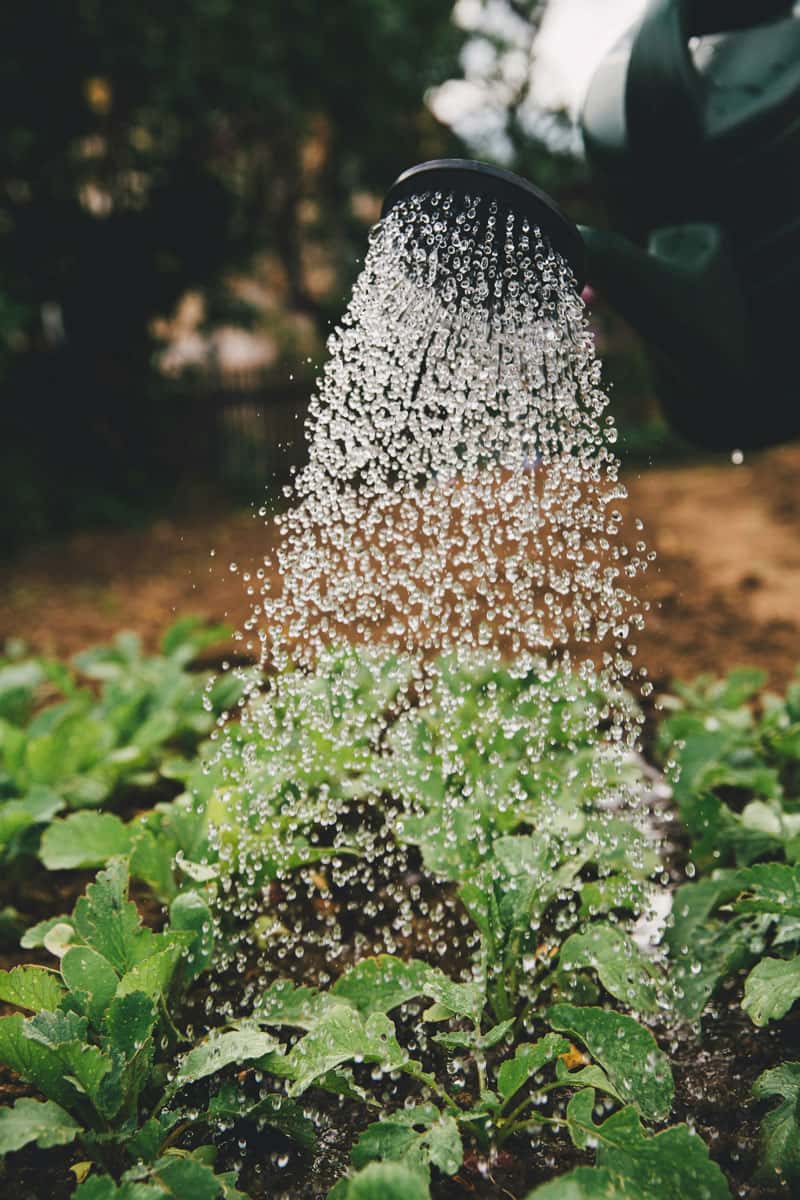
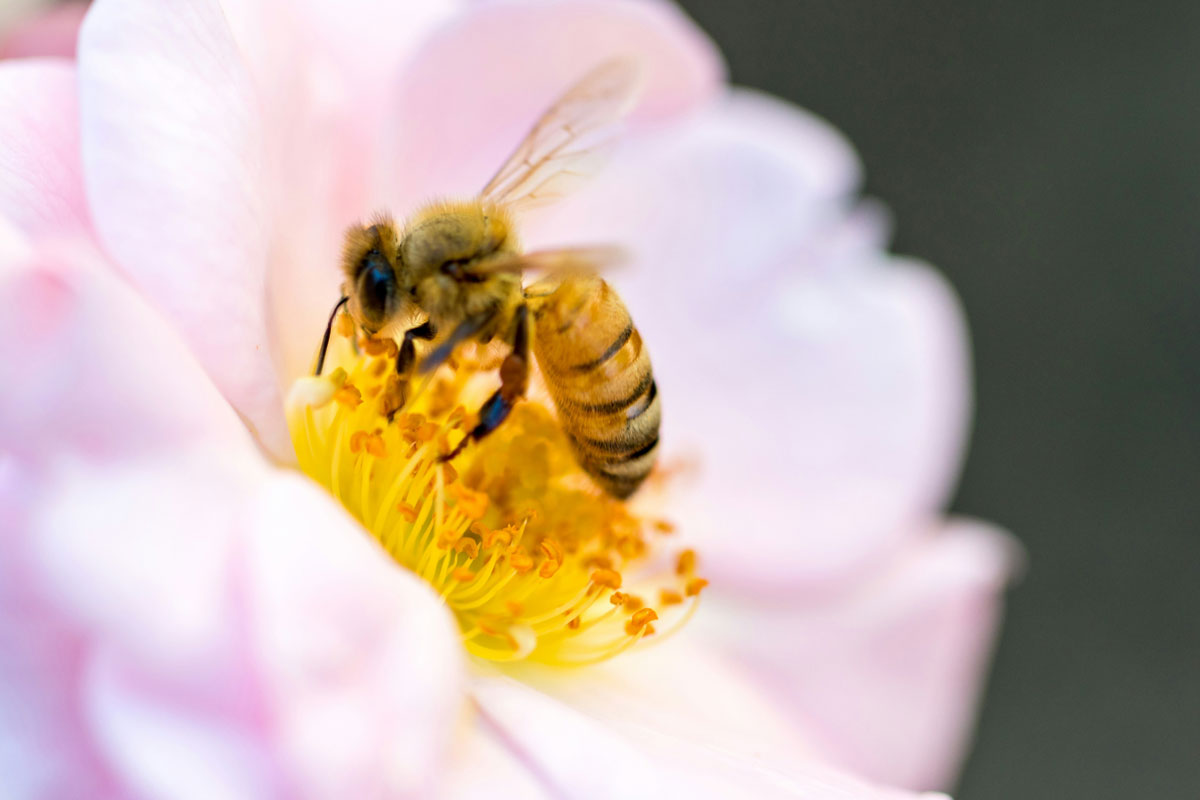
RegenIQ tackles coffee-growing challenges by prioritizing the most impactful efforts. For instance, optimizing nutrient rate and timing enhances plant growth, while avoiding deforestation preserves natural habitats. Implementing agroforestry boosts biodiversity, creating a healthier ecosystem. Additionally, managing irrigation optimally ensures coffee plants receive adequate moisture without depleting water sources, promoting long-term sustainability and resilience.
The efforts are a set of indicators to monitor the practices used to impact regenerative agriculture across soil health, water, biodiversity, and climate.

-
-
Residue management
15.3 / 28.5
-
Ground cover
30.4 / 30.4
-
Organic carbon application
17.5 / 33.4
-
Soil Compaction mitigation
1.9 / 7.0
Total
65.1 / 100
-
-
-
Water source
30.7 / 30.7
-
Water delivery method
22.8 / 22.8
-
Irrigation rate decision method
17.3 / 24.7
-
Irrigation power source
8.3 / 12.7
-
Milling type
3.6 / 9.1
Total
82.7 / 100
-
-
-
Deforestation avoidance
47.6 / 47.6
-
Agroforestry
19.0 / 19.0
-
Crop protection
5.0 / 12.4
-
Ground cover
11.5 / 11.5
-
Nutrient source
8.0 / 9.5
Total
91.1 / 100
-
-
-
Nutrient rate
14.9 / 34.5
-
Nutrient timing
26.9 / 26.9
-
Nutrient source
23.4 / 23.4
-
Soil pH management
11.8 / 15.2
Total
77.0 / 100
-
The outcomes are a set of indicators used to monitor sustainability levels and evaluate them against site-specific benchmarks.

-
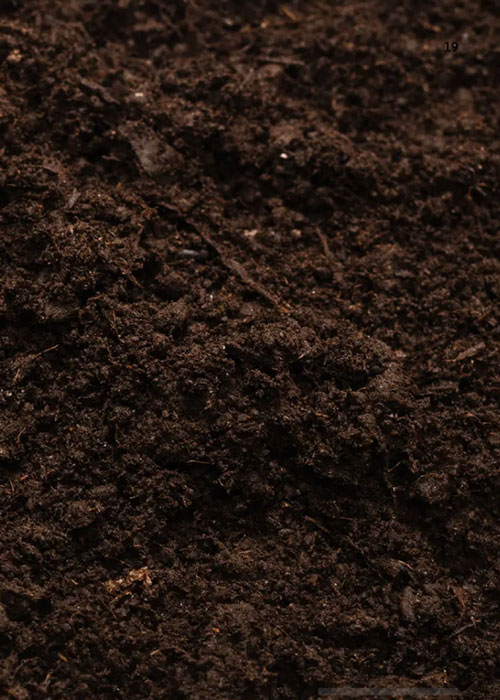
-
SOC / Clay ratio
6.7 / 16.7
-
Permanganate-oxidizable carbon
10.0 / 16.7
-
Soil respiration
6.7 / 16.7
-
ACE Protein
3.3 / 16.7
-
Aggregate stability
6.7 / 16.7
-
Earthworms density
10.0 / 16.7
Total
43.4 / 100
-
-
-
Irrigation water use
100.0 / 100.0
Total
100.0 / 100
-
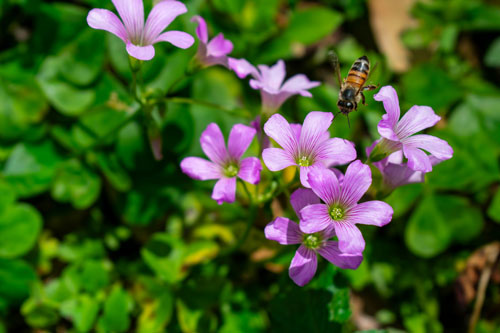
-
-
Diversity of shade tree species
15.0 / 25.0
-
Density of non-coffee tree
15.0 / 25.0
-
Beneficial insect diversity
10.0 / 25.0
-
Pollinator density
10.0 / 25.0
Total
50.0 / 100
-
-
-
N balance
16.7 / 33.3
-
P balance
0 / 33.3
-
Yield-scaled CO2 losses
20.0 / 33.3
Total
36.7 / 100
-